Market Outlook
December 6, 2017
Market Cues
Domestic Indices
Chg (%)
(Pts)
(Close)
Indian markets are likely to open negative tracking global indices and SGX Nifty.
BSE Sensex
(0.2)
(67)
32,802
U.S. stock-market indexes closed lower Tuesday, primarily owing to losses in utilities,
Nifty
(0.1)
(9)
10,118
telecoms and industrials sectors. The lower close on Wall Street may have reflected
Mid Cap
0.4
69
16,812
concerns about the outlook for the Republican tax reform bill amid reports about
Small Cap
(0.0)
(6)
17,919
disagreements over a corporate alternative minimum tax. The Dow fell by 0.5% to
Bankex
0.4
109
28,459
close at 24,181, the NASDAQ edged down 0.2% to end at 6,762 and the S&P 500
dipped 0.3% to finish at 2,630.
Global Indices
Chg (%)
(Pts)
(Close)
The FTSE 100 index UKX, shed 0.2% to end at 7,328. The mining shares struggling
Dow Jones
(0.5)
(109)
24,181
in particular, as investors assessed downbeat British services data.
Nasdaq
(0.2)
(13)
6,762
On domestic front, indices finished marginally lower on Tuesday as investors looked
FTSE
(0.2)
(11)
7,328
ahead to the RBI monetary policy review and the first phase of Gujarat elections due
Nikkei
(0.9)
(198)
22,425
this week. Another weighing sentiment was The Nikkei India Services PMI for
November which signaled slowdown in demand. The benchmark BSE Sensex fell
Hang Seng
(0.7)
(193)
28,649
0.20% to 32,802 while the broader Nifty index ended down 0.09% at 10,118.
Shanghai Com
(0.6)
(20)
3,284
News Analysis
Advances / Declines
BSE
NSE
LIC to slow down equity investment, after `44,000cr investment by Nov end
Advances
1,083
682
Detailed analysis on Pg2
Declines
1,587
1,072
Unchanged
152
67
Investor’s Ready Reckoner
Key Domestic & Global Indicators
Volumes (` Cr)
Stock Watch: Latest investment recommendations on 150+ stocks
BSE
4,187
Refer Pg5 onwards
NSE
25,495
Top Picks
CMP
Target
Upside
Company
Sector
Rating
(`)
(`)
(%)
Net Inflows (` Cr)
Net
Mtd
Ytd
Blue Star
Capital Goods
Buy
748
867
15.9
FII
4
4
57,636
Dewan Housing Finance
Financials
Buy
597
712
19.3
MFs
300
10,669 1,06,079
Asian Granito
Other
Accumulate
502
570
13.5
Navkar Corporation
Other
Buy
183
265
44.8
Top Gainers
Price (`)
Chg (%)
KEI Industries
Capital Goods Accumulate
401
425
5.9
More Top Picks on Pg4
Hathway
45
16.0
Den
106
10.4
Key Upcoming Events
Srtransfin
1,373
5.9
Previous
Consensus
Date
Region
Event Description
Reading
Expectations
Aegislog
245
5.3
Dec06
India
RBI Reverse Repo rate
5.75
5.75
Jetairways
678
5.3
Dec05
India
RBI Repo rate
6.00
6.00
Dec06
India
RBI Cash Reserve ratio
4.00
4.00
Top Losers
Price (`)
Chg (%)
Dec08
UK
Industrial Production (YoY)
2.50
Dec08
India
Imports YoY%
7.60
Advenzymes
278
(3.8)
More Events on Pg7
Sci
95
(3.7)
Sobha
570
(3.6)
Deltacorp
244
(3.5)
Jswenergy
81
(3.5)
As on December 05 2017
Market Outlook
December 6, 2017
News Analysis
LIC to slow down equity investment, after `44,000cr investment by
Nov end
The state-owned life insurance behemoth said it will book profits from its equity
investments whenever the opportunity arises. This, in a way, will also offset the fall
in income from debt investments in the current declining interest rate scenario.
LIC made equity investments amounting to ₹44,000cr, including in the initial
public offers of GIC Re and New India Assurance, and other government
disinvestment programmes in the April-November period against ₹29,000cr in the
year-ago period. In FY2017, the life insurer had made equity investments
amounting to ₹47,000cr.
LIC has seen some dip in income from investments in debt instruments due to
falling interest rate. LIC wants to invest more in government securities as it will be
beneficial for policy holders and pensioners.
Economic and Political News
Delinquencies in commercial vehicle, home loans to stay stable in 2018:
Moody's
Single authority to issue GST refund for exporters: Adhia
Services PMI contracts in November as GST hits foreign, domestic demand
Higher export relief for labour-intensive sectors
Corporate News
RBI allows foreign institutions to further buy shares of Bharat Financials
Lanco Infra to sell four renewable energy assets (Mint).
U.S. FDA approved Ranolazine Extended Release Oral Tablet of Aurobindo
Pharma:
Market Outlook
December 6, 2017
Top Picks HHHHH
Market Cap
CMP
Target
Upside
Company
Rationale
(` Cr)
(`)
(`)
(%)
Strong growth in domestic business due to its leade`hip
in acute therapeutic segment. Alkem expects to launch
Alkem Laboratories
25,174
2,106
2,252
7.0
more products in USA, which bodes for its international
business.
We expect the company would report strong profitability
Asian Granito
1,511
502
570
13.5
owing to better product mix, higher B2C sales and
amalgamation synergy.
Favorable outlook for the AC industry to augur well for
Cooling products business which is out pacing the
Blue Star
7,173
748
867
15.9
market growth. EMPPAC division's profitability to
improve once operating environment turns around.
With a focus on the low and medium income (LMI)
consumer segment, the company has increased its
Dewan Housing Finance
18,711
597
712
19.3
presence in tier-II & III cities where the growth
opportunity is immense.
Loan growth is likely to pick up after a sluggish FY17.
Lower credit cost will help in strong bottom-line growth.
Karur Vysya Bank
8,255
114
180
57.3
Increasing share of CASA will help in NIM
improvement.
High order book execution in EPC segment, rising B2C
KEI Industries
3,144
401
425
5.9
sales and higher exports to boost the revenues and
profitability
Expected to benefit from the lower capex requirement
Music Broadcast
2,193
384
434
12.9
and 15 year long radio broadcast licensing.
Massive capacity expansion along with rail advantage
Navkar Corporation
2,754
183
265
44.8
at ICD as well CFS augur well for the company
Strong brands and distribution network would boost
Siyaram Silk Mills
3,445
735
721
5.0
growth going ahead. Stock currently trades at an
inexpensive valuation.
Market leadership in Hindi news genre and no.
2
viewership ranking in English news genre, exit from the
TV Today Network
2,276
382
435
14.0
radio business, and anticipated growth in ad spends by
corporate to benefit the stock.
After GST, the company is expected to see higher
volumes along with improving product mix. The Gujarat
Maruti Suzuki
2,56,655
8,496
9,489
11.7
plant will also enable higher operating leverage which
will be margin accretive.
We expect loan book to grow at 24.3% over next two
GIC Housing
2,233
415
655
57.9
year; change in borrowing mix will help in NIM
improvement
We expect CPIL to report net Revenue/PAT CAGR of
~17%/16% over FY2017-20E mainly due to healthy
6,788
306
400
30.9
growth in plywood & lamination business, forayed into
Century Plyboards India
MDF & Particle boards on back of strong brand &
distribution network.
We expect sales/PAT to grow at 13.5%/20% over next
LT Foods
1,946
73
96
31.6
two years on the back of strong distribution network &
addition of new products in portfolio.
Source: Company, Angel Research
Market Outlook
December 6, 2017
Key Upcoming Events
Global economic events release calendar
Bl oomberg Data
D ate
Time
C ountry
Event Description
Unit
Period
L ast Reporte d
E stimate d
Dec 06, 2017
2:30 PM India
RBI Reverse Re po rate
%
Dec 6
5.75
5.75
2:30 PM India
RBI Repo rate
%
Dec 6
6.00
6.00
2:30 PM India
RBI Cash Reserve ratio
%
Dec 6
4.00
4.00
Dec 08, 2017
3:00 PM UK
Industrial Production (YoY)
% Change
Oct
2.50
India
Imports YoY%
% Change
Nov
7.60
India
Exports YoY%
% Change
Nov
(1.10)
China
Exports YoY%
% Change
Nov
6.90
7:00 PM US
Change in N onfarm payrolls
Thousands
Nov
261.00
198.00
7:00 AM China
Consumer Price Index (YoY)
% Change
Nov
1.90
1.80
Dec 09, 2017
7:00 PM US
Unnemployment rate
%
Nov
4.10
4.10
Dec 12, 2017
5:30 PM India
Industrial Production YoY
% Change
Oct
3.80
3:00 PM UK
CPI (YoY)
% Change
Nov
3.00
US
Producer Price Index (mom)
% Change
Nov
0.20
Dec 13, 2017
3:00 PM UK
Joble ss claims change
% Change
Nov
1.10
7:00 PM US
Consumer price index (mom)
% Change
Nov
0.10
0.40
Dec 14, 2017
7:30 AM China
Industrial Production (YoY)
% Change
Nov
6.20
12: 00 PM India
Monthly Wholesale Prices YoY%
% Change
Nov
3.59
5:30 PM UK
BOE Announce s rate s
% Ratio
Dec 14
0.50
0.50
6:15 PM Euro Zone
ECB announces interest rates
%
Dec 14
-
7:45 PM US
Industrial Production
%
Nov
0.94
Dec 15, 2017
3:30 PM Euro Zone
Euro-Zone CPI (YoY)
%
Nov F
1.40
Dec 18, 2017
12: 30 AM US
FOMC rate decision
%
Dec 13
1.25
1.50
Dec 19, 2017
7:00 PM US
Housi ng Starts
Thousands
Nov
1,290.00
7:00 PM US
Building permits
Thousands
Nov
1,316.00
Source: Bloomberg, Angel Research
Market Outlook
December 6, 2017
Key Upcoming Events
Result Calendar
D ate
C ompany
November 14, 2017
Tata Global, JK Tyre, CEAT, Jyoti Structures, Bank of Baroda, Reliance Capital, Corporation Bank, MOIL
November 15, 2017
Automotive Axle
Source: Bloomberg, Angel Research
Global economic events release calendar
Bl oomberg Data
D ate
Time
C ountry
Event Description
Unit
Period
L ast Reporte d
E stimate d
Dec 06, 2017
2:30 PMIndia
RBI Reverse Re po rate
%
Dec 6
5.75
5.75
2:30 PMIndia
RBI Repo rate
%
Dec 6
6.00
6.00
2:30 PMIndia
RBI Cash Reserve ratio
%
Dec 6
4.00
4.00
Dec 08, 2017
3:00 PMUK
Industrial Production (YoY)
% Change
Oct
2.50
India
Imports YoY%
% Change
Nov
7.60
India
Exports YoY%
% Change
Nov
(1.10)
China
Exports YoY%
% Change
Nov
6.90
7:00 PMUS
Change in N onfarm payrolls
Thousands
Nov
261.00
198.00
7:00 AMChina
Consumer Price Index (YoY)
% Change
Nov
1.90
1.80
Dec 09, 2017
7:00 PMUS
Unnemployment rate
%
Nov
4.10
4.10
Dec 12, 2017
5:30 PMIndia
Industrial Production YoY
% Change
Oct
3.80
3:00 PMUK
CPI (YoY)
% Change
Nov
3.00
US
Producer Price Index (mom)
% Change
Nov
0.20
Dec 13, 2017
3:00 PMUK
Joble ss claims change
% Change
Nov
1.10
7:00 PMUS
Consumer price index (mom)
% Change
Nov
0.10
0.40
Source: Bloomberg, Angel Research
Market Outlook
December 6, 2017
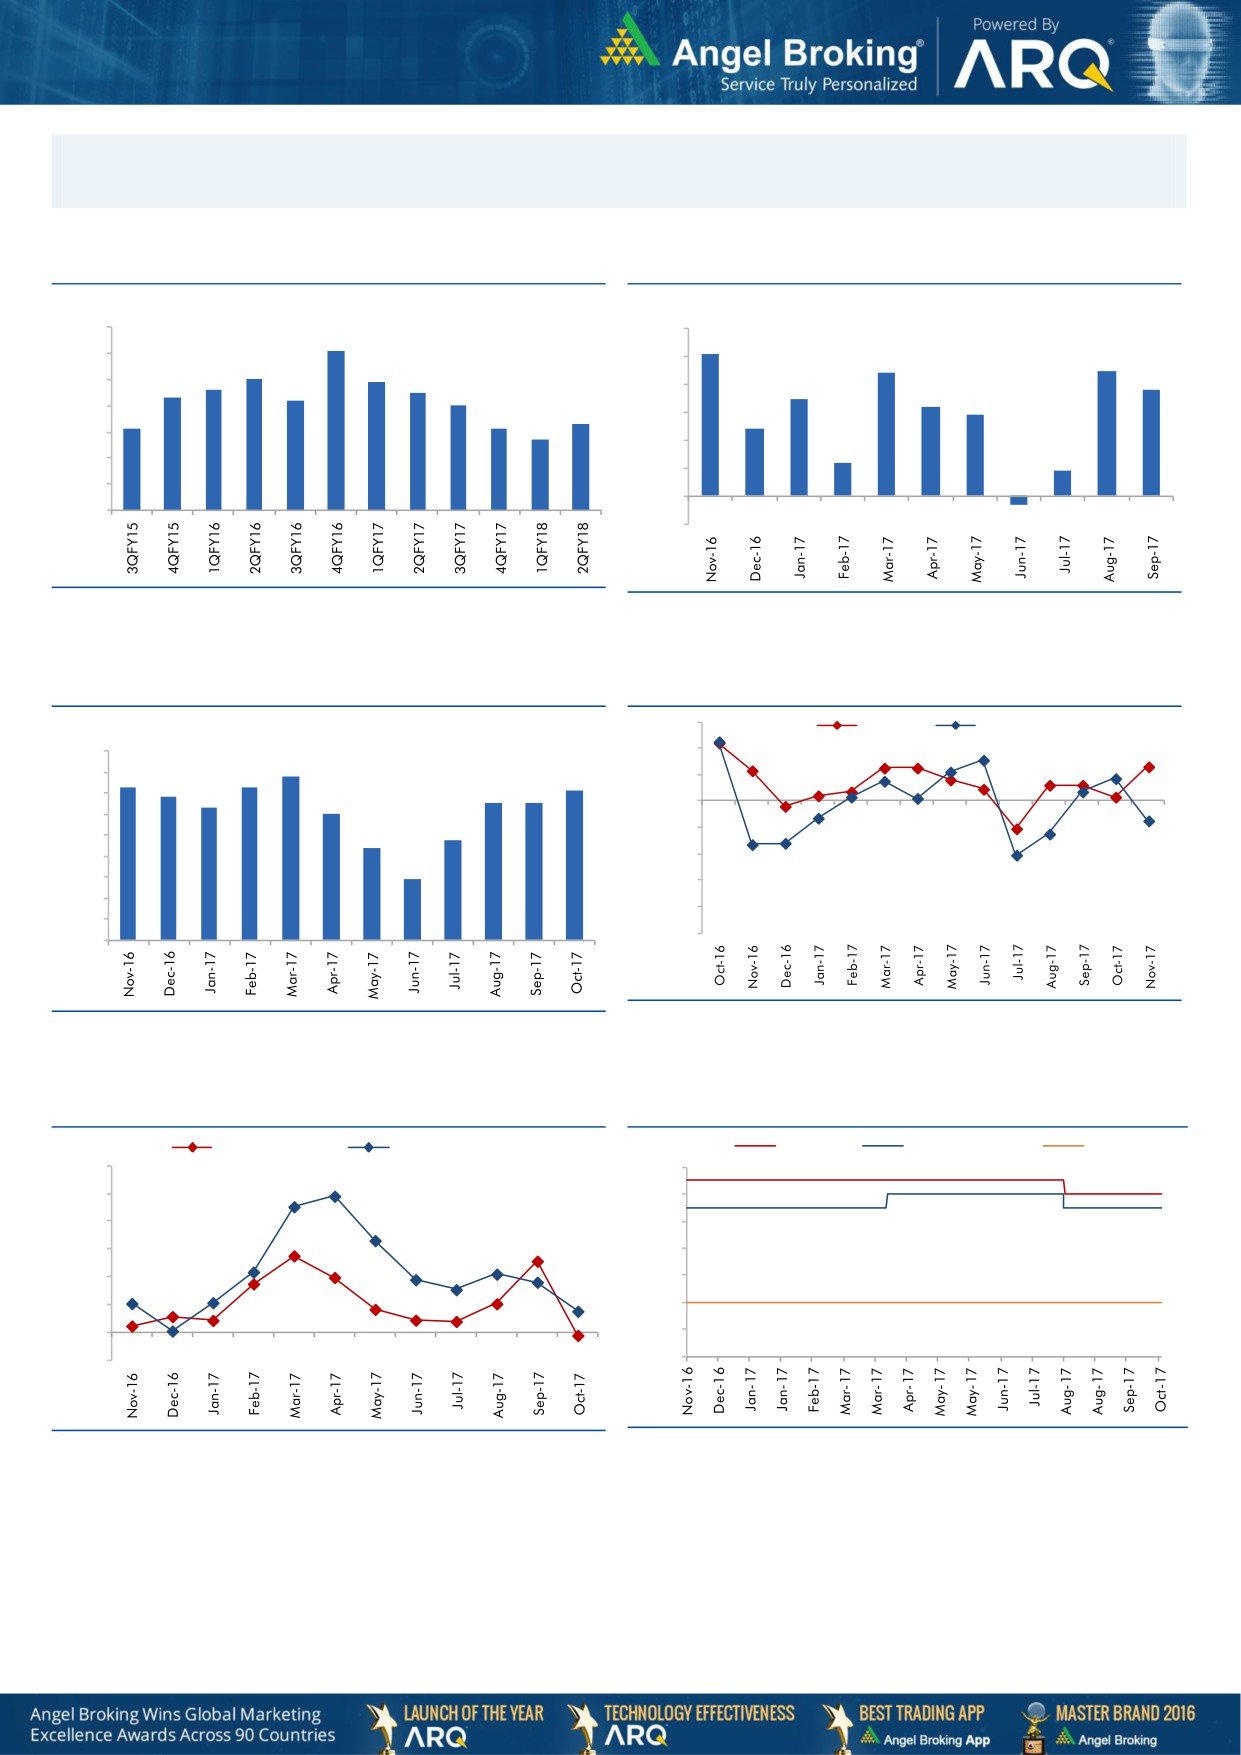
Macro watch
Exhibit 1: Quarterly GDP trends
Exhibit 2: IIP trends
(%)
(%)
10.0
6.0
9.1
5.1
9.0
5.0
4.4
4.5
8.0
7.9
7.6
7.5
3.8
8.0
7.3
7.2
4.0
3.5
7.0
3.2
2.9
7.0
6.3
6.1
6.1
3.0
2.4
5.7
6.0
2.0
1.2
5.0
0.9
1.0
4.0
-
3.0
(1.0)
(0.3)
Source: CSO, Angel Research
Source: MOSPI, Angel Research
Exhibit 3: Monthly CPI inflation trends
Exhibit 4: Manufacturing and services PMI
56.0
Mfg. PMI
Services PMI
(%)
4.5
54.0
3.9
4.0
3.6
3.7
3.6
52.0
3.4
3.2
3.3
3.3
3.5
3.0
50.0
3.0
2.4
48.0
2.5
2.2
2.0
46.0
1.5
1.5
44.0
1.0
42.0
0.5
40.0
-
Source: Market, Angel Research; Note: Level above 50 indicates expansion
Source: MOSPI, Angel Research
Exhibit 5: Exports and imports growth trends
Exhibit 6: Key policy rates
(%)
Exports yoy growth
Imports yoy growth
(%)
Repo rate
Reverse Repo rate
CRR
60.0
6.50
50.0
6.00
40.0
5.50
30.0
5.00
20.0
4.50
10.0
4.00
0.0
3.50
(10.0)
3.00
Source: Bloomberg, Angel Research
Source: RBI, Angel Research
Market Outlook
December 6, 2017
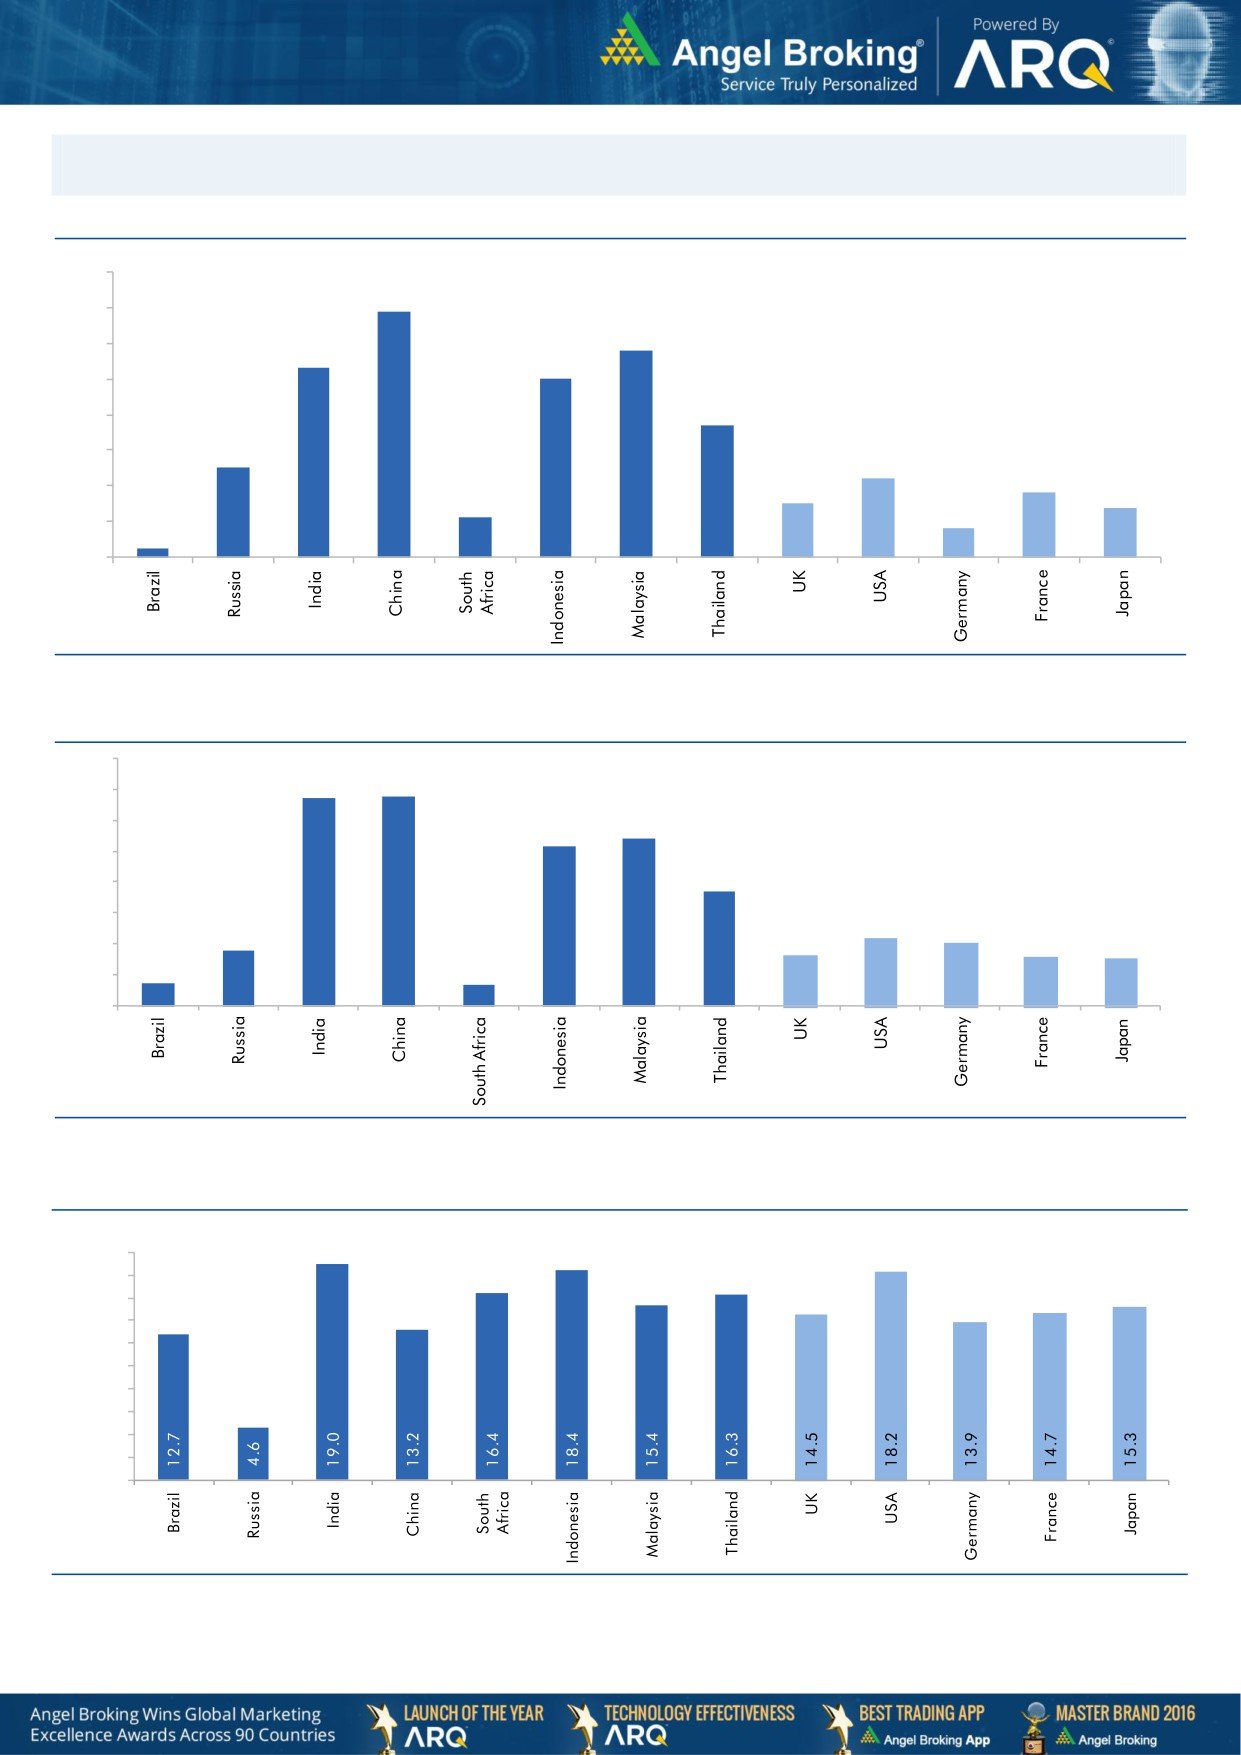
Global watch
Exhibit 1: Latest quarterly GDP Growth (%, yoy) across select developing and developed countries
(%)
8.0
6.9
7.0
5.8
6.0
5.3
5.0
5.0
1.1
3.7
4.0
2.5
3.0
2.2
1.8
2.0
1.5
1.4
0.8
1.0
0.3
-
Source: Bloomberg, Angel Research
Exhibit 2: 2017 GDP Growth projection by IMF (%, yoy) across select developing and developed countries
(%)
6.7
6.8
7.0
6.0
5.4
5.2
5.0
3.7
4.0
3.0
1.8
2.2
2.0
1.7
1.6
2.0
0.7
1.5
0.7
1.0
-
Source: IMF, Angel Research
Exhibit 3: One year forward P-E ratio across select developing and developed countries
(x)
20.0
18.0
16.0
14.0
12.0
10.0
8.0
6.0
4.0
2.0
-
Source: IMF, Angel Research
Market Outlook
December 6, 2017
Exhibit 4: Relative performance of indices across globe
Returns (%)
C ountry
Name of index
Closing price
1M
3M
1YR
Brazil
Bovespa
72,546
(2.4)
2.3
17.2
Russia
Micex
2,114
2.0
5.5
(2.2)
India
Nifty
10,118
(3.2)
2.1
25.1
China
Shanghai Composite
3,304
(3.1)
(2.3)
0.2
South Africa
Top 40
52,413
(1.5)
5.6
20.7
Mexico
Mexbol
47,463
(1.8)
(6.6)
4.1
Indonesia
LQ45
1,012
1.1
4.7
17.2
Malaysia
KLCI
1,725
(0.9)
(2.1)
6.2
Thailand
SET 50
1,090
1.0
5.4
17.5
USA
Dow Jones
24,181
2.8
11.2
25.6
UK
FTSE
7,328
(3.1)
(0.4)
6.2
Japan
Nikkei
22,622
0.9
15.1
23.6
Germany
DAX
13,049
(3.2)
7.8
16.7
France
CAC
5,376
(2.6)
5.4
11.9
Source: Bloomberg, Angel Research p68in4
Stock Watch
December 06, 2017
Company Name
Reco
CMP
Target
Mkt Cap
Sales ( Čcr )
OPM(%)
EPS (Č)
PER(x)
P/BV(x)
RoE(%)
EV/Sales(x)
(Č)
Price ( Č)
( Č cr )
FY18E FY19E
FY18E
FY19E
FY18E
FY19E
FY18E
FY19E
FY18E
FY19E
FY18E
FY19E
FY18E
FY19E
Agri / Agri Chemical
Rallis
Reduce
241
209
4,681
1,873
2,099
15.0
15.0
9.5
10.5
25.3
22.9
3.9
3.5
15.8
16.0
2.4
2.2
United Phosphorus
Buy
699
820
35,509
18,922
21,949
18.0
18.5
36.2
45.6
19.3
15.3
4.0
3.3
22.7
23.8
2.0
1.7
Auto & Auto Ancillary
Ashok Leyland
Accumulate
114
127
33,413
23,339
27,240
10.1
10.8
4.7
6.2
24.6
18.4
4.9
4.3
20.0
23.6
1.4
1.2
Bajaj Auto
Neutral
3,161
-
91,465
23,936
27,955
19.5
20.1
142.7
167.3
22.1
18.9
4.8
4.3
21.8
22.8
3.4
2.9
Bharat Forge
Buy
698
875
32,503
7,637
8,755
21.7
23.2
36.1
47.3
19.3
14.8
3.5
3.0
18.5
20.8
4.1
3.5
Eicher Motors
Neutral
28,929
-
78,752
19,043
22,837
19.5
19.9
835.4
1,019.0
34.6
28.4
12.9
10.0
40.9
37.8
4.0
3.3
Gabriel India
Neutral
189
-
2,714
1,782
2,033
9.7
10.2
7.1
8.9
26.6
21.4
5.4
4.5
21.0
22.2
1.5
1.3
Hero Motocorp
Buy
3,522
4,129
70,340
32,239
36,878
16.0
15.6
184.4
206.5
19.1
17.1
6.0
5.3
31.3
30.7
2.0
1.7
Jamna Auto Industries Neutral
65
-
2,604
1,441
1,662
14.4
14.8
13.9
17.6
4.7
3.7
1.3
1.0
30.0
31.0
1.8
1.5
Mahindra and Mahindra Neutral
1,389
-
86,368
46,971
53,816
13.6
14.0
67.7
79.8
20.5
17.4
2.9
2.6
15.0
15.9
1.7
1.5
Maruti
Accumulate
8,496
9,489
256,655
79,470
95,208
15.9
17.2
281.7
363.8
30.2
23.4
6.6
5.3
21.7
22.8
2.9
2.3
Minda Industries
Neutral
1,131
-
9,774
4,328
5,084
11.0
11.9
27.3
36.4
41.5
31.1
8.8
6.9
23.1
25.6
2.3
2.0
Motherson Sumi
Neutral
362
-
76,123
55,937
64,445
10.8
11.4
16.9
21.1
21.4
17.2
4.8
4.9
25.2
25.4
1.4
1.2
Tata Motors
Neutral
402
-
116,172
303,167
343,649
11.8
13.8
33.1
54.7
12.2
7.4
2.0
1.6
16.9
23.0
0.4
0.4
TVS Motor
Neutral
737
-
35,028
13,992
16,216
9.0
9.4
17.1
20.3
43.2
36.3
11.5
8.9
29.7
27.7
2.4
2.1
Amara Raja Batteries
Accumulate
776
858
13,260
6,140
7,122
14.3
15.6
29.3
39.0
26.5
19.9
4.5
3.8
17.1
19.0
2.2
1.9
Exide Industries
Neutral
203
-
17,238
8,689
9,854
15.1
15.2
9.7
11.0
21.0
18.4
3.7
3.3
15.7
16.1
1.7
1.5
Apollo Tyres
Neutral
240
-
13,712
15,739
17,326
13.3
14.6
20.4
26.7
11.8
9.0
1.4
1.3
20.4
26.7
1.1
1.0
Ceat
Neutral
1,719
-
6,955
6,661
7,717
11.1
14.2
116.2
178.2
14.8
9.7
2.6
2.1
15.2
21.3
1.2
1.0
JK Tyres
Neutral
136
-
3,073
8,318
9,239
16.2
16.4
21.0
27.5
6.5
4.9
1.3
1.0
19.1
20.4
0.8
0.7
Swaraj Engines
Neutral
1,945
-
2,416
788
889
16.4
16.5
71.6
81.0
27.2
24.0
7.8
7.3
29.6
31.0
2.7
2.4
Subros
Neutral
257
-
1,540
1,855
2,135
11.6
11.8
10.3
14.7
25.1
17.5
3.8
3.3
15.8
19.1
1.0
0.9
Capital Goods
BEML
Neutral
1,569
-
6,533
4,286
5,194
7.1
8.2
42.9
58.1
36.6
27.0
3.0
2.7
7.6
8.7
1.6
1.3
Bharat Electronics
Neutral
182
-
44,742
10,258
12,470
19.6
19.5
7.3
8.6
25.0
21.2
0.5
0.4
20.4
21.9
3.9
3.1
Voltas
Neutral
622
-
20,588
6,778
8,004
9.6
11.0
17.1
22.4
36.4
27.8
8.7
7.6
17.7
19.8
2.7
2.3
BHEL
Neutral
90
-
33,061
33,200
39,167
6.8
9.5
6.2
11.2
14.5
8.0
0.7
0.6
4.6
8.0
0.6
0.4
Blue Star
Buy
748
867
7,173
5,220
6,207
6.3
6.6
16.8
22.3
44.5
33.6
8.8
7.8
19.9
23.3
1.3
1.1
CG Power and Industrial
Neutral
85
-
5,309
6,555
7,292
7.5
7.5
-
0.8
8,470.0
105.9
1.3
1.3
0.1
1.2
0.9
0.8
Solutions
Greaves Cotton
Neutral
118
-
2,889
1,778
1,993
14.7
15.1
8.1
9.1
14.6
13.0
3.3
3.1
21.8
23.6
1.4
1.2
Stock Watch
December 06, 2017
Company Name
Reco
CMP
Target
Mkt Cap
Sales ( Čcr )
OPM(%)
EPS (Č)
PER(x)
P/BV(x)
RoE(%)
EV/Sales(x)
(Č)
Price ( Č)
( Č cr )
FY18E FY19E
FY18E
FY19E
FY18E
FY19E
FY18E
FY19E
FY18E
FY19E
FY18E
FY19E
FY18E
FY19E
Capital Goods
KEC International
Accumulate
313
350
8,052
9,779
11,113
9.4
9.8
14.2
18.2
22.1
17.2
4.2
3.5
21.1
22.1
1.1
1.0
KEI Industries
Accumulate
401
425
3,144
3,001
3,391
10.0
10.0
13.0
16.1
30.8
24.9
5.6
4.7
18.2
18.7
1.2
1.1
Thermax
Neutral
1,089
-
12,980
4,125
4,747
10.3
10.8
26.7
31.5
40.8
34.6
4.6
4.2
11.2
12.0
2.9
2.5
VATech Wabag
Accumulate
601
681
3,282
3,867
4,126
9.6
10.0
34.9
39.8
17.2
15.1
2.9
2.5
17.7
17.5
0.9
0.8
Cement
ACC
Neutral
1,689
-
31,708
12,255
13,350
13.5
14.3
58.0
66.2
29.1
25.5
3.5
3.2
11.5
12.2
2.6
2.3
Ambuja Cements
Neutral
260
-
51,657
10,250
11,450
17.5
19.0
7.2
8.3
36.1
31.3
2.6
2.4
7.0
7.8
4.8
4.2
India Cements
Neutral
168
-
5,165
6,135
6,750
14.8
15.2
8.5
11.5
19.7
14.6
1.0
0.9
4.8
6.2
1.2
1.0
JK Cement
Neutral
993
-
6,943
4,150
4,775
19.2
20.0
49.0
63.5
20.3
15.6
3.2
2.8
17.0
18.5
2.1
1.8
J K Lakshmi Cement
Neutral
411
-
4,839
3,422
3,757
15.5
17.0
13.5
23.2
30.5
17.7
3.2
2.7
10.8
15.5
1.8
1.6
Orient Cement
Neutral
165
-
3,376
2,215
3,233
16.8
17.0
5.9
6.9
27.9
23.9
2.1
2.0
10.8
10.1
2.5
1.7
UltraTech Cement
Neutral
4,110
-
112,836
28,250
35,150
20.2
23.5
77.5
122.2
53.0
33.6
4.5
4.1
9.6
14.8
4.5
3.6
Construction
KNR Constructions
Neutral
275
-
3,873
1,846
2,203
14.5
14.5
12.1
13.7
22.8
20.2
1.3
1.1
17.5
16.7
2.1
1.8
Larsen & Toubro
Neutral
1,207
-
169,147
95,787
109,476
10.2
11.6
44.5
50.8
27.2
23.8
3.4
3.1
12.9
13.1
2.3
2.0
Gujarat Pipavav Port
Neutral
139
-
6,705
739
842
61.6
62.7
5.1
6.2
27.2
22.6
3.4
3.3
12.7
14.9
8.5
7.4
PNC Infratech
Neutral
187
-
4,787
2,040
2,935
13.0
13.0
6.4
9.0
29.2
20.7
0.8
0.7
9.7
12.2
2.3
1.7
Simplex Infra
Neutral
564
-
2,788
6,012
6,619
11.6
11.7
21.1
31.0
26.8
18.2
1.9
1.7
6.5
8.6
1.0
0.9
Sadbhav Engineering
Neutral
372
-
6,382
3,823
4,426
10.7
10.8
10.3
11.8
36.1
31.5
4.3
3.8
10.1
10.5
2.0
1.7
NBCC
Neutral
257
-
23,099
9,099
12,706
6.4
6.4
7.3
9.6
35.3
26.8
1.6
1.2
27.5
30.5
2.4
1.7
MEP Infra
Neutral
93
-
1,513
2,403
2,910
18.3
16.8
2.4
6.1
39.6
15.3
15.0
10.1
35.2
55.8
1.8
1.5
SIPL
Neutral
137
-
4,808
2,060
2,390
46.8
47.7
(5.8)
(3.1)
5.1
5.8
(14.2)
(2.3)
7.1
6.6
Engineers India
Neutral
184
-
12,389
1,795
2,611
21.1
22.4
5.9
8.1
31.2
22.7
2.2
2.2
12.9
16.1
5.3
3.5
Financials
Axis Bank
Accumulate
534
580
128,013
32,558
35,843
3.5
3.2
27.8
41.0
19.2
13.0
2.1
1.8
11.4
14.9
-
-
Bank of Baroda
Neutral
170
-
39,125
22,533
26,079
2.4
2.4
12.0
20.9
14.1
8.1
0.9
0.9
6.6
11.0
-
-
Canara Bank
Neutral
373
-
22,297
17,925
20,235
2.0
2.1
18.5
36.5
20.2
10.2
0.8
0.7
3.4
6.2
-
-
Can Fin Homes
Neutral
464
-
6,178
586
741
3.5
3.5
107.8
141.0
4.3
3.3
0.9
0.8
24.1
25.6
-
-
Cholamandalam Inv. &
Neutral
1,306
-
20,406
2,826
3,307
6.3
6.3
53.7
64.6
24.3
20.2
4.1
3.5
18.3
18.9
-
-
Fin. Co.
Dewan Housing Finance Buy
597
712
18,711
2,676
3,383
2.4
2.7
37.4
49.7
16.0
12.0
2.1
1.8
13.8
16.2
-
-
Equitas Holdings
Buy
139
235
4,732
1,125
1,380
9.6
9.8
1.5
6.0
92.9
23.2
2.1
2.0
2.4
8.2
-
-
Federal Bank
Buy
108
125
21,211
4,896
5,930
2.8
3.1
5.4
7.6
20.1
14.3
1.7
1.6
8.5
11.0
-
-
Stock Watch
December 06, 2017
Company Name
Reco
CMP
Target
Mkt Cap
Sales ( Čcr )
OPM(%)
EPS (Č)
PER(x)
P/BV(x)
RoE(%)
EV/Sales(x)
(Č)
Price ( Č)
( Č cr )
FY18E FY19E
FY18E
FY19E
FY18E
FY19E
FY18E
FY19E
FY18E
FY19E
FY18E
FY19E
FY18E
FY19E
Financials
GIC Housing
Buy
415
655
2,233
376
477
3.6
3.7
33.0
40.0
12.6
10.4
2.3
1.9
20.0
23.0
-
-
HDFC Bank
Neutral
1,823
-
471,817
55,236
63,253
4.5
4.4
68.9
82.4
26.5
22.1
4.6
3.8
18.7
18.5
-
-
ICICI Bank
Neutral
305
-
196,096
42,361
51,378
3.6
3.9
18.4
25.7
16.6
11.9
1.8
1.8
11.3
15.0
-
-
Karur Vysya Bank
Buy
114
180
8,255
3,289
3,630
3.7
3.9
10.8
14.1
10.6
8.1
1.3
1.1
12.5
14.7
-
-
LIC Housing Finance
Accumulate
573
630
28,902
4,895
6,332
3.4
3.7
50.7
66.8
11.3
8.6
2.3
1.9
21.7
23.8
-
-
Punjab Natl.Bank
Neutral
176
-
37,452
23,708
25,758
2.1
2.1
5.9
16.4
29.9
10.7
0.9
0.8
3.0
8.3
-
-
RBL Bank
Neutral
510
-
21,268
2,309
2,888
2.6
2.5
16.4
19.1
31.2
26.8
3.9
3.5
13.3
13.8
-
-
Repco Home Finance
Buy
611
825
3,825
496
597
4.4
4.2
38.5
48.7
15.9
12.5
2.9
2.4
19.6
20.6
-
-
South Ind.Bank
Neutral
32
-
5,697
3,195
3,567
3.0
3.1
3.0
3.8
10.5
8.2
1.0
0.9
10.5
11.9
-
-
St Bk of India
Neutral
319
-
275,621
105,827
121,056
2.4
2.5
16.1
25.6
19.8
12.5
1.6
1.4
6.6
9.9
-
-
Union Bank
Neutral
161
-
11,703
14,650
16,225
2.3
2.3
23.1
32.5
7.0
5.0
0.5
0.5
7.1
9.2
-
-
Yes Bank
Neutral
309
-
70,893
11,088
13,138
3.0
2.9
84.0
99.3
3.7
3.1
0.6
0.5
16.3
16.8
-
-
FMCG
Akzo Nobel India
Neutral
1,781
-
8,542
3,164
3,607
13.8
13.7
58.6
67.9
30.4
26.2
7.5
6.6
24.5
25.1
2.6
2.2
Asian Paints
Neutral
1,114
-
106,879
17,603
20,615
18.6
18.6
2,128.9
2,543.3
0.5
0.4
11.0
9.3
28.0
28.9
5.9
4.9
Britannia
Neutral
4,764
-
57,192
9,690
11,278
14.8
15.4
84.0
101.0
56.7
47.2
20.7
16.4
40.6
39.0
5.9
5.0
Colgate
Neutral
1,030
-
28,023
4,420
5,074
24.9
25.3
28.6
32.8
36.0
31.4
14.2
11.5
43.8
40.5
6.1
5.3
Dabur India
Neutral
343
-
60,447
8,346
9,344
19.6
19.9
7.8
9.0
44.0
38.1
8.9
8.0
25.2
24.8
6.8
6.0
GlaxoSmith Con*
Neutral
6,083
-
25,583
5,072
5,760
18.2
18.4
176.3
199.2
34.5
30.5
7.3
6.6
21.2
21.7
4.4
3.8
Godrej Consumer
Neutral
978
-
66,620
10,171
11,682
20.8
21.5
21.7
27.1
45.1
36.1
10.1
8.7
22.3
23.4
6.7
5.8
HUL
Neutral
1,261
-
272,865
37,077
41,508
20.3
21.8
5,189.9
6,318.5
0.2
0.2
38.4
32.8
74.8
82.0
7.2
6.4
ITC
Neutral
254
-
309,641
44,588
49,853
37.0
37.3
9.6
11.0
26.5
23.1
6.5
6.2
25.1
27.3
6.4
5.7
Marico
Neutral
309
-
39,943
6,788
7,766
18.5
19.2
7.1
8.5
43.6
36.4
15.2
13.1
36.9
38.0
5.7
5.0
Nestle*
Neutral
7,695
-
74,192
10,083
11,182
20.0
20.9
119.7
141.3
64.3
54.5
226.6
207.1
36.7
39.8
7.0
6.3
Tata Global
Neutral
280
-
17,668
7,121
7,641
11.9
12.3
6.9
8.0
40.6
35.0
2.7
2.6
6.8
7.2
2.3
2.1
Procter & Gamble
Neutral
9,802
-
31,817
3,034
3,579
27.1
27.7
167.7
198.8
58.5
49.3
15.7
13.5
28.8
29.5
9.9
8.3
Hygiene
IT
HCL Tech^
Buy
845
1,014
120,645
50,009
54,608
22.1
22.1
62.8
67.6
13.5
12.5
3.0
2.6
22.4
20.6
2.1
1.8
Infosys
Accumulate
984
1,120
226,116
70,333
75,960
26.0
26.0
61.7
65.9
16.0
14.9
3.0
2.8
18.9
18.7
2.6
2.4
TCS
Reduce
2,634
2,442
504,185
123,384
134,488
26.1
26.1
133.2
143.7
19.8
18.3
5.5
5.1
27.6
27.8
3.7
3.4
Tech Mahindra
Accumulate
466
526
45,510
30,545
32,988
15.0
15.0
35.2
37.6
13.2
12.4
2.2
2.1
16.8
16.2
1.3
1.1
Stock Watch
December 06, 2017
Company Name
Reco
CMP
Target
Mkt Cap
Sales ( Čcr )
OPM(%)
EPS (Č)
PER(x)
P/BV(x)
RoE(%)
EV/Sales(x)
(Č)
Price ( Č)
( Č cr )
FY18E FY19E
FY18E
FY19E
FY18E
FY19E
FY18E
FY19E
FY18E
FY19E
FY18E
FY19E
FY18E
FY19E
IT
Wipro
Neutral
283
-
137,922
54,164
56,544
22.3
22.3
18.8
19.5
15.1
14.5
2.4
2.1
15.0
13.6
1.8
1.5
Media
D B Corp
Neutral
352
-
6,482
2,404
2,625
30.5
31.5
23.7
26.9
14.9
13.1
3.5
3.0
23.5
22.8
2.5
2.3
HT Media
Neutral
98
-
2,283
2,589
2,830
15.1
15.4
8.3
10.9
11.8
9.0
1.0
0.9
8.4
10.4
0.4
0.3
Jagran Prakashan
Buy
164
225
5,109
2,541
2,835
28.5
28.7
12.7
14.1
12.9
11.6
2.7
2.3
21.3
21.4
1.9
1.6
Sun TV Network
Neutral
856
-
33,722
3,238
3,789
51.9
55.1
30.9
38.0
27.7
22.5
7.9
6.9
30.0
31.0
9.9
8.4
Hindustan Media
Neutral
244
-
1,791
1,002
1,074
23.3
23.5
29.2
33.8
8.4
7.2
1.3
1.1
15.6
15.4
0.8
0.5
Ventures
TV Today Network
Accumulate
382
435
2,276
667
727
27.7
27.7
18.6
20.1
20.5
19.0
3.2
3.3
15.6
17.3
2.9
2.7
Music Broadcast Limited Accumulate
384
434
2,193
271
317
91.0
109.0
6.0
10.0
64.1
38.4
4.0
3.6
6.5
9.3
7.7
6.3
Metals & Mining
Coal India
Neutral
265
-
164,652
82,301
91,235
17.0
18.0
17.1
20.5
15.5
12.9
2.9
2.7
45.0
55.0
1.7
1.5
Hind. Zinc
Neutral
295
-
124,731
22,108
24,555
57.0
58.0
22.1
26.3
13.4
11.2
4.3
3.5
32.0
35.0
4.6
3.9
Hindalco
Neutral
240
-
53,830
102,350
105,355
13.5
14.5
21.5
24.5
11.2
9.8
1.5
1.3
15.0
15.2
1.1
1.0
JSW Steel
Neutral
249
-
60,104
64,500
68,245
21.1
21.5
20.1
21.2
12.4
11.7
2.3
1.9
-
-
1.7
1.6
NMDC
Neutral
132
-
41,779
10,209
11,450
47.0
48.0
11.1
12.1
11.9
10.9
1.6
1.6
-
-
3.6
3.3
SAIL
Neutral
78
-
32,318
54,100
63,555
3.0
10.0
(10.0)
1.5
52.2
1.0
1.0
-
-
1.6
1.4
Vedanta
Neutral
288
-
107,222
81,206
87,345
28.0
29.0
26.5
33.5
10.9
8.6
2.5
2.1
-
-
2.1
1.8
Tata Steel
Neutral
676
-
65,649
121,445
126,500
16.2
17.2
65.4
81.3
10.3
8.3
1.6
1.4
-
-
1.1
0.9
Oil & Gas
GAIL
Neutral
462
-
78,214
53,115
52,344
14.2
15.3
30.0
31.1
15.4
14.9
1.9
1.8
-
-
1.2
1.2
ONGC
Neutral
178
-
228,945
83,111
84,934
44.2
44.9
16.4
16.9
10.9
10.6
1.3
1.2
-
-
2.6
2.6
Indian Oil Corp
Neutral
391
-
189,623
396,116
432,560
8.5
8.8
40.1
42.2
9.7
9.3
1.7
1.5
-
-
0.6
0.6
Reliance Industries
Neutral
912
-
592,822
257,711
267,438
17.0
18.2
89.1
89.5
10.2
10.2
1.0
0.9
-
-
2.0
1.9
Pharmaceuticals
Alembic Pharma
Buy
516
600
9,726
3,346
3,915
19.6
19.2
21.0
23.9
24.6
21.6
4.3
3.7
19.1
18.4
2.9
2.5
Alkem Laboratories Ltd
Accumulate
2,106
2,252
25,174
6,320
7,341
17.5
19.8
72.7
96.6
29.0
21.8
5.1
4.3
16.7
18.7
3.9
3.3
Aurobindo Pharma
Buy
670
823
39,237
17,086
19,478
22.1
22.0
44.7
51.4
15.0
13.0
3.3
2.7
24.7
22.7
2.4
2.1
Aventis*
Neutral
4,385
-
10,099
2,411
2,698
18.8
18.8
151.6
163.9
28.9
26.8
4.5
3.6
25.4
27.5
3.8
3.2
Cadila Healthcare
Neutral
425
-
43,473
11,365
12,926
20.0
20.0
18.4
20.5
23.1
20.7
5.1
4.2
24.3
22.2
3.9
3.4
Cipla
Sell
596
462
48,004
16,163
18,711
16.6
16.9
20.7
24.3
28.8
24.6
3.4
3.0
12.6
13.1
3.1
2.7
Dr Reddy's
Reduce
2,210
2,040
36,653
13,734
15,548
17.7
20.2
69.9
102.0
31.6
21.7
2.8
2.6
9.2
12.4
2.9
2.5
GSK Pharma*
Sell
2,468
2,000
20,905
2,968
3,324
13.8
15.9
37.8
46.3
65.3
53.3
11.4
12.5
16.7
22.4
6.8
6.3
Indoco Remedies
Sell
270
136
2,491
1,114
1,297
9.9
13.9
5.6
11.4
48.3
23.7
3.7
3.3
7.7
14.5
2.5
2.1
Stock Watch
December 06, 2017
Company Name
Reco
CMP
Target
Mkt Cap
Sales ( Čcr )
OPM(%)
EPS (Č)
PER(x)
P/BV(x)
RoE(%)
EV/Sales(x)
(Č)
Price ( Č)
( Č cr )
FY18E FY19E
FY18E
FY19E
FY18E
FY19E
FY18E
FY19E
FY18E
FY19E
FY18E
FY19E
FY18E
FY19E
Pharmaceuticals
Ipca labs
Accumulate
530
570
6,682
3,256
3,647
14.1
17.1
16.2
25.4
32.7
20.9
2.5
2.3
8.0
11.5
2.1
1.9
Lupin
Buy
810
1,091
36,593
16,240
18,562
21.3
21.7
42.5
49.6
19.1
16.3
2.4
2.1
13.3
13.7
2.4
2.0
Natco Pharma
Accumulate
946
1,057
16,509
1,886
2,016
32.3
29.5
23.2
22.0
40.9
42.9
8.6
7.6
20.9
17.6
8.6
8.0
Sun Pharma
Buy
524
615
125,637
28,312
31,826
20.7
22.4
18.5
22.3
28.3
23.5
3.2
2.9
11.5
14.0
4.1
3.5
Syngene International
Accumulate
550
587
11,004
1,394
1,818
33.0
36.5
15.8
21.0
34.8
26.2
6.5
5.3
18.6
20.3
7.9
6.0
Power
Tata Power
Neutral
89
-
24,045
32,547
33,806
20.5
20.5
4.7
5.4
18.9
16.6
1.8
1.6
10.5
10.5
1.7
1.7
NTPC
Neutral
177
-
145,739
86,070
101,246
28.3
30.7
12.9
16.2
13.7
10.9
1.4
1.3
10.6
12.4
3.1
2.7
Power Grid
Accumulate
200
223
104,710
29,183
32,946
89.7
90.0
18.0
20.8
11.2
9.6
1.9
1.7
17.7
18.2
7.5
7.0
Real Estate
Prestige Estate
Neutral
312
-
11,700
4,607
5,146
21.0
22.2
7.9
9.8
39.5
31.8
2.4
2.3
10.3
12.0
3.7
3.4
MLIFE
Accumulate
465
522
2,385
487
590
12.3
17.8
21.0
31.2
22.1
14.9
1.2
1.1
5.2
7.4
3.6
2.9
Telecom
Bharti Airtel
Neutral
491
-
196,072
97,903
105,233
36.0
36.3
9.3
11.1
52.7
44.4
2.6
2.4
5.0
5.6
3.0
2.7
Idea Cellular
Neutral
93
-
33,693
35,012
37,689
27.1
27.7
(4.4)
(2.7)
1.5
1.5
(6.8)
(4.6)
2.3
2.0
zOthers
Abbott India
Neutral
5,521
-
11,731
3,244
3,723
14.9
16.1
167.5
209.4
33.0
26.4
7.3
6.1
23.7
24.8
3.3
2.8
Asian Granito
Accumulate
502
570
1,511
1,169
1,286
12.5
12.5
16.0
19.7
31.4
25.5
3.4
3.0
10.7
11.6
1.5
1.4
Bajaj Electricals
Neutral
448
-
4,558
4,646
5,301
6.7
7.6
16.1
22.3
27.8
20.1
4.6
3.9
16.4
19.2
1.0
0.9
Banco Products (India)
Neutral
240
-
1,715
1,530
1,695
13.2
12.7
19.0
20.0
12.6
12.0
2.0
1.8
0.2
0.2
1.0
115.0
Coffee Day Enterprises
Neutral
265
-
5,453
3,494
3,913
17.4
18.0
4.8
5.7
-
46.5
2.3
2.2
-
0.1
2.0
1.8
Ltd
Elecon Engineering
Neutral
86
-
964
171
201
15.0
16.2
36.0
43.0
2.4
2.0
0.2
0.2
0.1
0.1
5.0
4.3
Garware Wall Ropes
Neutral
919
-
2,010
928
1,003
15.2
15.2
39.4
43.2
23.3
21.3
3.8
3.3
16.5
15.4
2.0
1.8
Goodyear India*
Neutral
868
-
2,003
1,717
1,866
11.8
12.3
47.9
49.8
18.1
17.5
2.8
2.4
15.6
15.7
0.9
123.5
Hitachi
Neutral
2,489
-
6,768
2,355
2,715
10.3
10.8
49.0
60.9
50.8
40.9
11.9
9.4
0.2
0.2
2.9
2.5
HSIL
Neutral
503
-
3,638
2,240
2,670
14.6
15.0
17.0
22.0
29.6
22.9
2.4
2.3
0.1
0.1
1.8
1.5
Interglobe Aviation
Neutral
1,155
-
44,379
22,570
27,955
14.2
15.0
63.6
81.8
18.2
14.1
9.6
8.1
0.5
0.6
1.6
1.2
Jyothy Laboratories
Neutral
361
-
6,564
1,781
2,044
14.1
15.0
9.4
10.5
38.6
34.4
8.2
7.7
0.2
0.2
3.9
3.3
Linc Pen & Plastics
Neutral
295
-
436
420
462
9.3
9.3
15.3
17.1
19.3
17.3
3.3
3.4
16.9
19.5
1.1
1.0
M M Forgings
Neutral
938
-
1,132
542
642
20.1
21.0
41.6
56.8
22.6
16.5
3.1
2.6
0.1
0.2
2.5
2.2
Mirza International
Neutral
158
-
1,903
1,148
1,285
18.0
18.0
8.0
9.4
19.7
16.9
3.3
2.8
16.3
16.1
1.8
1.6
Navkar Corporation
Buy
183
265
2,754
561
617
41.5
41.5
11.5
12.7
15.9
14.4
1.7
1.5
10.5
10.4
5.6
4.9
Nilkamal
Neutral
1,676
-
2,501
2,317
2,525
11.4
11.1
96.0
105.0
17.5
16.0
3.0
2.6
0.2
0.2
1.1
1.0
Stock Watch
December 06, 2017
Company Name
Reco
CMP
Target Mkt Cap
Sales ( Čcr )
OPM(%)
EPS (Č)
PER(x)
P/BV(x)
RoE(%)
EV/Sales(x)
(Č)
Price ( Č)
( Č cr )
FY18E FY19E FY18E FY19E FY18E FY19E FY18E FY19E FY18E FY19E FY18E FY19E FY18E FY19E
zOthers
Parag Milk Foods
Neutral
244
-
2,055
1,987
2,379
7.6
9.0
12.4
18.3
19.7
13.4
2.8
2.4
8.2
13.2
1.1
1.0
Radico Khaitan
Neutral
289
-
3,854
1,811
1,992
13.2
13.2
8.1
8.8
35.7
32.9
3.6
3.9
10.1
12.0
2.5
2.2
Relaxo Footwears
Neutral
609
-
7,328
1,981
2,310
13.7
14.5
12.0
15.5
50.7
39.3
9.9
8.0
0.2
0.2
3.8
3.2
Siyaram Silk Mills
Neutral
735
-
3,445
1,769
1,981
12.7
12.7
22.6
26.2
32.5
28.0
5.0
4.3
15.5
15.5
2.1
1.9
Styrolution ABS India* Neutral
1,054
-
1,854
1,800
1,980
8.0
8.1
42.0
46.2
25.1
22.8
2.8
2.5
0.1
0.1
1.1
1.1
Surya Roshni
Neutral
361
-
1,582
4,870
5,320
7.7
7.8
22.8
28.1
15.9
12.9
2.1
1.8
0.1
0.1
0.5
0.5
TVS Srichakra
Neutral
3,303
-
2,529
2,729
2,893
12.7
12.5
248.5
265.0
13.3
12.5
3.8
3.1
0.3
0.3
0.9
0.9
Visaka Industries
Neutral
612
-
971
1,104
1,214
12.1
12.6
31.0
37.9
19.7
16.2
2.4
2.2
0.1
0.1
1.1
1.0
VIP Industries
Buy
336
400
4,750
1,450
1,693
10.4
10.5
6.5
7.8
51.4
43.0
10.9
9.5
21.1
22.1
3.3
2.8
Navin Fluorine
Neutral
697
-
3,437
945
1,154
17.5
17.9
28.7
34.8
24.3
20.0
4.0
3.4
-
-
3.2
2.5
Source: Company, Angel Research; Note: *December year end; #September year end; &October year end; Price as on December 05, 2017
Market Outlook
December 06, 2017
Research Team Tel: 022 - 39357800
DISCLAIMER
Angel Broking Private Limited (hereinafter referred to as “Angel”) is a registered Member of National Stock Exchange of India
Limited,Bombay Stock Exchange Limited and Metropolitan Stock Exchange Limited. It is also registered as a Depository Participant with
CDSL and Portfolio Manager with SEBI. It also has registration with AMFI as a Mutual Fund Distributor. Angel Broking Private Limited is a
registered entity with SEBI for Research Analyst in terms of SEBI (Research Analyst) Regulations, 2014 vide registration number
INH000000164. Angel or its associates has not been debarred/ suspended by SEBI or any other regulatory authority for accessing
/dealing in securities Market. Angel or its associates/analyst has not received any compensation / managed or
co-managed public offering of securities of the company covered by Analyst during the past twelve months.
This document is solely for the personal information of the recipient, and must not be singularly used as the basis of any investment
decision. Nothing in this document should be construed as investment or financial advice. Each recipient of this document should make
such investigations as they deem necessary to arrive at an independent evaluation of an investment in the securities of the companies
referred to in this document (including the merits and risks involved), and should consult their own advisors to determine the merits and
risks of such an investment.
Reports based on technical and derivative analysis center on studying charts of a stock's price movement, outstanding positions and
trading volume, as opposed to focusing on a company's fundamentals and, as such, may not match with a report on a company's
fundamentals. Investors are advised to refer the Fundamental and Technical Research Reports available on our website to evaluate the
contrary view, if any.
The information in this document has been printed on the basis of publicly available information, internal data and other reliable
sources believed to be true, but we do not represent that it is accurate or complete and it should not be relied on as such, as this
document is for general guidance only. Angel Broking Pvt. Limited or any of its affiliates/ group companies shall not be in any way
responsible for any loss or damage that may arise to any person from any inadvertent error in the information contained in this report.
Angel Broking Pvt. Limited has not independently verified all the information contained within this document. Accordingly, we cannot
testify, nor make any representation or warranty, express or implied, to the accuracy, contents or data contained within this document.
While Angel Broking Pvt. Limited endeavors to update on a reasonable basis the information discussed in this material, there may be
regulatory, compliance, or other reasons that prevent us from doing so.
This document is being supplied to you solely for your information, and its contents, information or data may not be reproduced,
redistributed or passed on, directly or indirectly.
Neither Angel Broking Pvt. Limited, nor its directors, employees or affiliates shall be liable for any loss or damage that may arise from
or in connection with the use of this information.